Archive

All posts

616 posts latest post 2026-10-06
Publishing rhythm
Jun 2026 | 3 posts

Polybar-01

polybar is an awesome and super customizable status bar for your desktop environment. I use it with i3-gaps on Ubuntu for work and it makes my day just that much better to have a clean and elegant bar with the things in it that I care about. The GitHub has all the instructions you’d need to install and get started with an example. I want to make some notes about how I use polybar and customize it. Organization # First of all, I recently moved my polybar config out of one config file into a modular structure that keeps my config files small and easiser to edit. You can find my config here The apps or services you put into polybar are called. I have moved all of my modules into their own config files and I source them with one centralized config. This separation also makes it easier for me to keep my home and work polybars as in sync as possible without duplicating a ton of config! To break this down there are several configs to see: is what you’d expect - a set of defined colors like,,…

I am working on a project to create a small system monitoring dashboard using the python psutil library.

The repo is here (if you want actual system monitoring please use netdata).

I’m using streamlit and plotly for the webserver, design, and plotting at the moment.

My Use Case #

I needed a way to refresh my plotly charts with a fixed window of time so that I’m able to just see relevant recent data instead of cramming all data for all time into one plot that’s 500 pixels wide…

Checking the length of arrays or lists every time I get a new piece of data feels kind of dumb and I thought “python must have a way to do this”…

“This” meaning, update values in a fixed length array without reallocating memory or recreating a copy of the list

Deques #

Enter the deque. It means “double ended queue” and is in general an Iterable that you can append values to either side or pop values from either side.

The init signature is straightforward enough and I’m sure there’s more to them than I know yet but here’s how I use it…

from collections import deque

my_deque = deque([1,2,3])

This gives us my_deque, created from an iterable, with several familiar methods like index, extend, append, etc. However there’s some new ones too such as appendleft and popleft.

my_deque.appendleft('a')
print(my_dequqe)
>>> deque(['a', 1, 2, 3])

my_deque.popleft()
>>> 'a'

<!--markata-attribution-->
print(my_deque)
>>> deque([1, 2, 3])

These are handy ways to manipulate the iterable that I needed for the arrays I plot with plotly!

See my follow-up to this on using Deques with plotly and streamlit to create a quick “dashboard” with live streaming data!

follow-up

Plotly-And-Streamlit

Streamlit # I use for any EDA I ever have to do at work. It’s super easy to spin up a small dashboard to filter and view dataframes in, live, without the fallbacks of Jupyter notebooks (kernels dying, memory bloat, a billion “Untitled N.ipynb” files, etc.) At the highest level, streamlit lets you write a python script and call which will open up a web server with your streamlit stuff. The dashboard refreshes whenever you change the script so you can add capabilities in real time, super fast! I’ll show an example of using and to make a live dashboard to monitor system memory usage with. This is apart of my posts on psutil and deques … example at the bottom! Plotly # I’m not going to make a big time intro to plotly here - there’s a billion resources on the interwebs and the docs are really good. Suffice it to say it’s my goto plotting library for basically any and all needs. I’m currently exploring it for live data streaming as I’m not sure it’s the best solution but it’s the one I’m fam…

Starship

If you spend time in the terminal then you’ll want it to look somewhat pleasing to the eye. I used to ssh into servers with no customization, use to edit a file or two, then get back to my regularly scheduled programming in VS C**e… One of the first steps for me loving my terminal was a beautiful prompt… Prompt # The default sh/bash/zsh prompts are… to put it lightly… garbage… I can’t speak for other shells like fish simply because I do not use them but let me justify my trash talk. Here’s the default prompt… Then switching to you get something marginally better (plus tab completion!) But this still is super gross… there’s nothing to indicate file types and no status information readily available (ie. etc.) Oh-My-Zsh! # Now there are several ways to make your prmompt nicer depending on your shell (terminal emulator plays a role too). Now I use and there’s a great tool out there oh-my-zsh that brings a crazy amount of customization to the terminal experience. I do not use for theming th…
self-hosted-media

self-hosted-media

Self-hosting 1 or several media servers is another common homelab use-case. Getting content for your media servers is up to you, but I’ll show a few ways here to get content somewhat easily! YouTube Disclaimer at Bottom you-get # is a nice cli for grabbing media content off the web. Installation # or use ad-hoc with Usage # For example if I wanted to catch up on ancient Chinese military tactics I may go for off the Internet Archive… the is showing me the info of what would be downloaded without the flag (it’s like a dry run) Now I can toss that mp3 onto my server and study for world domination while I do the dishes! pytube # is a python implementation of a youtube downloader that works at the command line or in python! Installation # docs Usage # has a lot of functionality, but a quick one would be the so you can see what qualities are available will download the specific from the list. Notice that some are videos and others audio - so you can download just the music of a YT video. als…

EDA #

I work with data a lot, but the nature of my job isn’t to dive super deep into a small amount of datasets, I’m often jumping between several projects every day and need to just get a super quick glance at some tables to get a high level view.

When I’m doing more interactive exploration I’ve graduated from Jupyter cells with df_N.head() to using an amazing tool called visidata

However, Visidata is a terminal based application and I’m often in an iPython console… so is there a way to move even faster for my super quick summary views?

yes!

Skimpy #

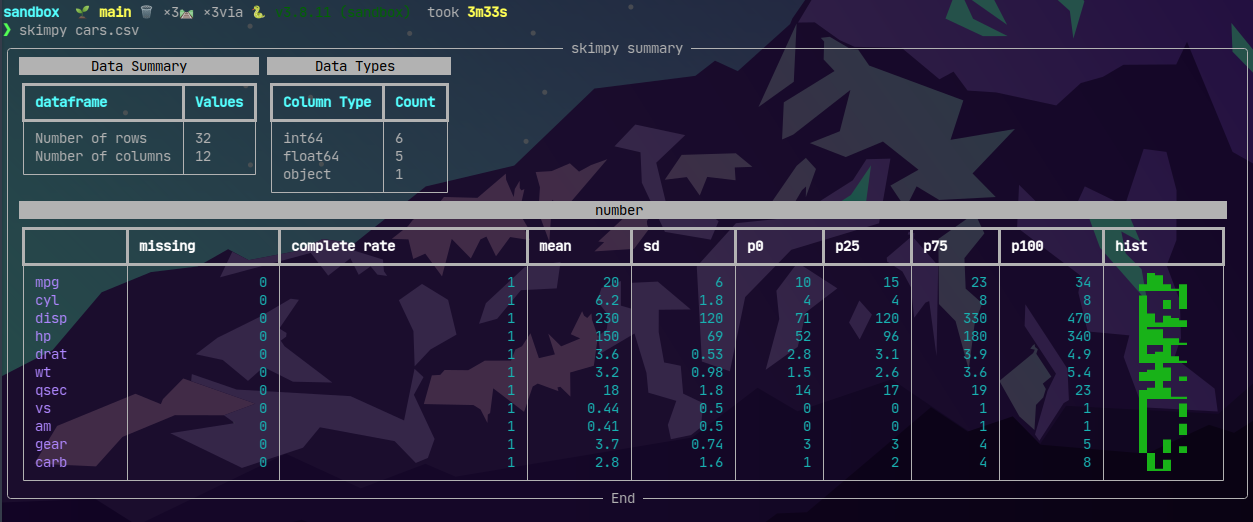
First thing to do is pip install skimpy and then it’s as easy to get some summary stats with skimpy <data>

Skimpy ZSH

This is super nice for seeing missing values in particular as well as the distribution shape of the data.

iPython #

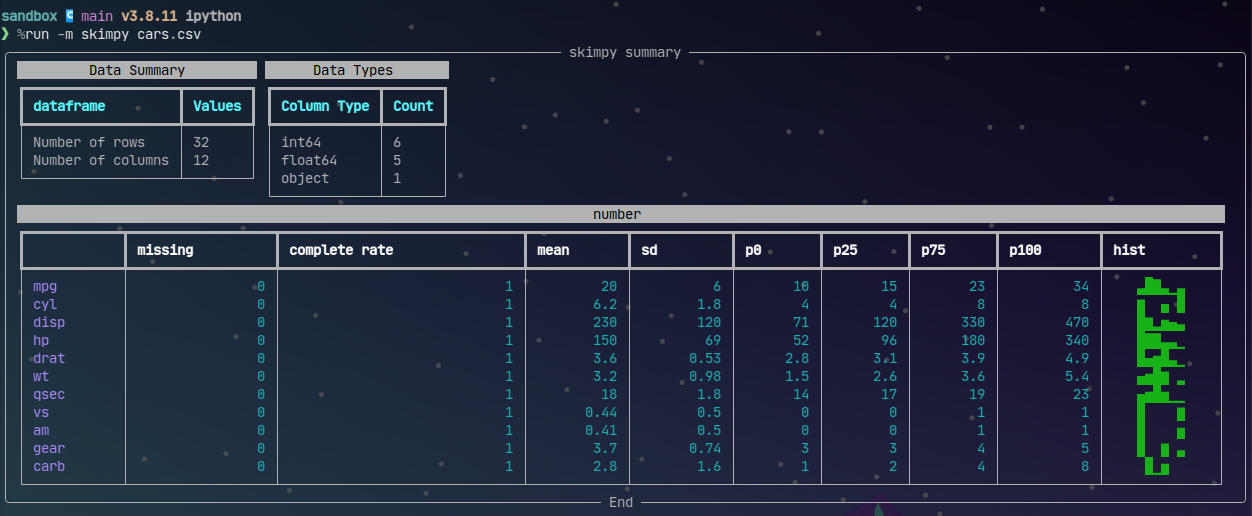
But wait… I just said I’m normally in an iPython session but that was called from zsh.. If I’m hoping back into zsh I might as well use visidata to have more powerful exploration at my fingertips. So… can I see this table quickly without breaking my iPython workflow?

Of course you can with magic!

Skimpy iPython

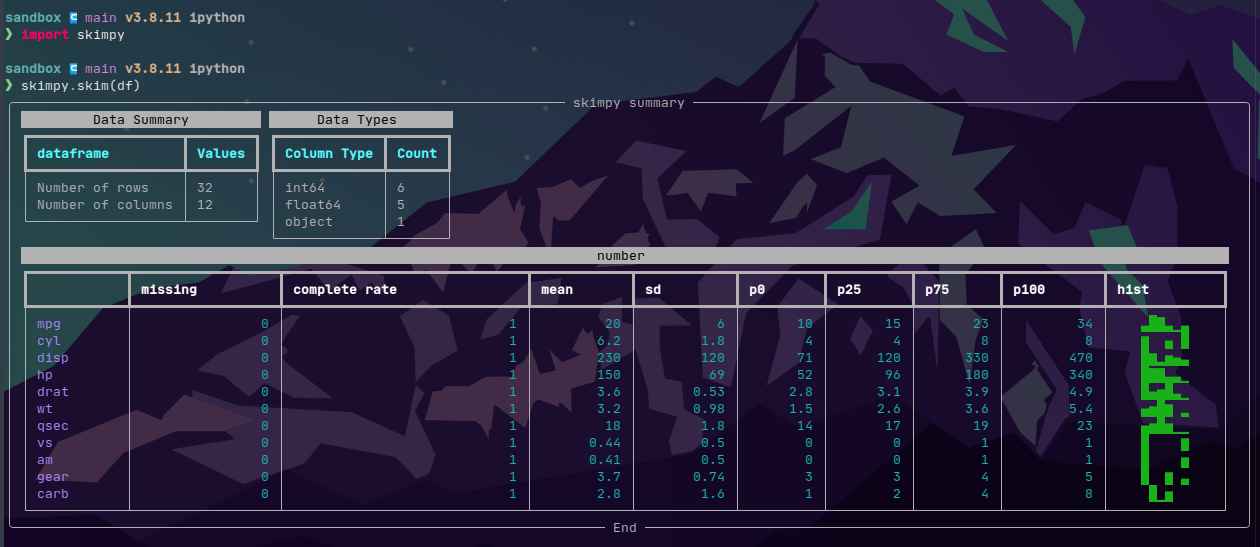
The above assumes you’re looking at a file, like you would in the terminal. skimpy works even better in iPython with from skimpy import skim then pass any DataFrame to skim!

Skimpy iPython2

Truenas-And-Wireguard

NAS # One of the most common use cases for self-hosting anything is a file share system. I have been a fan of TrueNAS for a while. I currently use TrueNAS Core at home, and plan to consider transitioning to TrueNAS Scale soon. Blog post forthcoming on that! VPN # I don’t write a ton about homelabbing yet but one of the first things to set up whether you have a massive homelab or a little raspberry pi would be a self-hosted VPN. I have notes on wireguard here. I finally have a need to put my TrueNAS box on my wireguard network in order to transfer files to other devices that are outside my LAN. There is a handy tutorial on setting this up via the GUI here. They walk you through setting up 2 tunables wireguard. One to enable the the connection and one to setup the network interface. Next you create a script which will check that the right directories exist and will copy the wireguard config that hasn’t been made yet to the proper location and finally starts wireguard. The above is just c…

I like to keep my workspace clean and one thing that I don’t personally love looking at is the __pycache__ directory that pops up after running some code. The *.pyc files that show up there are python bytecode and they are cached to make subsequent runs a tad faster. My stuff never really needs this bonus speed boost and so I came across a neat tool called pyclean!

Pyclean #

The easiest way (in my opinion) to run pyclean is to just use pipx run.

sandbox/src  🌱 main 🗑️  ×3🛤️  ×2via 🐍 v3.8.11 (sandbox)  took 9s
❯ ls
abcmeta.py  __pycache__  python-print-align.py  system-monitor-psutils.py

sandbox/src  🌱 main 🗑️  ×3🛤️  ×2via 🐍 v3.8.11 (sandbox)
❯ pipx run pyclean .
⚠️  pyclean is already on your PATH and installed at /usr/bin/pyclean. Downloading and running anyway.
Cleaning directory .
Total 1 files, 1 directories removed.

sandbox/src  🌱 main 🗑️  ×3🛤️  ×2via 🐍 v3.8.11 (sandbox)
❯ ls
abcmeta.py  python-print-align.py  system-monitor-psutils.py

Why not bash? #

You could accomplish something similar with rm **/*.pyc or find -n '*.py?' -delete but there’s a chance you’ll find something you don’t love gone. Also this won’t help our poor Windows friends out there! pyclean is fully python so it’s OS independent.

Credits! #

repo

Mike Driscoll has been posting some awesome posts about psutil lately. I’m interested in making my own system monitoring dashboard now using this library. I don’t expect it to compete with Netdata or Glances but it’ll just be for fun to see how Python can solve this problem!

Repo coming soon

Example code: #

Here’s a short snippit to get used/available/total RAM and disk space (on partitions that you probably care about)


import psutil
import socket

print(f"System Memory used: {psutil.virtual_memory().used // (1024 ** 3)} GB")
print(f"System Memory available: {psutil.virtual_memory().available // (1024 ** 3)} GB")
print(f"System Memory total: {psutil.virtual_memory().total // (1024 ** 3)} GB")


print(f"Hostname: {socket.gethostname()}")

partitions = psutil.disk_partitions()

for part in partitions:
    mnt = part.mountpoint
    if "snap" in mnt or "boot" in mnt:
        continue
    disk = psutil.disk_usage(mnt)
    print(f"Usage at {mnt} on {part.device}: {disk.used // (1024 ** 3)} GB")
    print(f"Free at {mnt} on {part.device}: {disk.free // (1024 ** 3)}GB")
    print(f"Total at {mnt} on {part.device}: {disk.total // (1024 ** 3)}GB")

Bonus Ipython tip! Save this to a script called my_script.py and in Ipython you can %run -m my_script to run it!

project ↪ main v3.8.11 ipython
❯ %run -m system-monitor-psutils
System Memory used: 25 GB
System Memory available: 5 GB
System Memory total: 31 GB
Hostname: ryzen-3600x
Usage at / on /dev/nvme1n1p2: 81 GB
Free at / on /dev/nvme1n1p2: 351 GB
Total at / on /dev/nvme1n1p2: 456 GB

If you work with a template for several projects then you might sometimes need to do the same action across all repos. A good example of this is updating a package in requirements.txt in every project, or refactoring a common module. If you have several repos to do this across then it can be time consuming… enter mu-repo

Mu #

mu-repo is an awesome cli tool for working with multiple git repositories at the same time. There are several things you can do:

  1. mu status will give you the git status of every registered repo (see below)
  2. mu sh will let you execute system level commands in every repo
  3. mu stash will stash all changes across all registered repos
  4. There’s literally a ton more but these are some handy ones

Registration #

mu tracks its own groups, and there is a default group when no particular one is active. It’s as simple as mu register proj1 prog2 ... to get repos registered


❯ mu register proj1 proj2
Repository: proj1 registered
Repository: proj2 registered

❯ mu status

  proj1 : git status
    On branch main

    No commits yet

    Untracked files:
    (use "git add <file>..." to include in what will be committed)
    requirements.txt

    nothing added to commit but untracked files present (use "git add" to track)

  proj2 : git status
    On branch main

    No commits yet

    Changes to be committed:
    (use "git rm --cached <file>..." to unstage)
    new file:   requirements.txt


Working with mu #

As you can see above I have two projects each with a requirements.txt added but not committed yet. Using mu I can stage this change across both repos at once.


❯ mu add requirements.txt

  proj1 : git add requirements.txt

  proj2 : git add requirements.txt

Then as you might imagine, I can make the commit in each repo


❯ mu commit -m "Add requirements.txts"

  proj1 : git commit -m Add requirements.txts
    [main (root-commit) 18376d7] Add requirements.txts
    1 file changed, 1 insertion(+)
    create mode 100644 requirements.txt

  proj2 : git commit -m Add requirements.txts
    [main (root-commit) 18376d7] Add requirements.txts
    1 file changed, 1 insertion(+)
    create mode 100644 requirements.txt

mu groups #

The other thing I got a lot of use out of recently was mu’s groups. At work I have about 40 repos cloned that are all based on the same kedro pipeline template. Some of these projects have been deprecated. I also have several more repos that are not kedro template - custom libraries or something. group let me utilize mu across different groups of repos.

Say proj2 is a deprecated project that I don’t need to worry about making changes to anymore. I don’t just have to unregister it, instead I can make a group called “active” and register proj1 in that group


❯ mu group add active --empty

~/personal
❯ mu group add deprecated --empty

~/personal
❯ mu group
  active
* deprecated

The * tells me which group is active. The --empty flag tells mu to not add all registered repos to that group. If I don’t want to use any groups then mu group reset will go back to the default group with all registered repos.

With groups I can register only the repos that I want to be working across in their own group and not worry about affecting other repos with my batch changes!